
Products
Revenue concentration by product and the lifetime customer-progression funnel.
Products
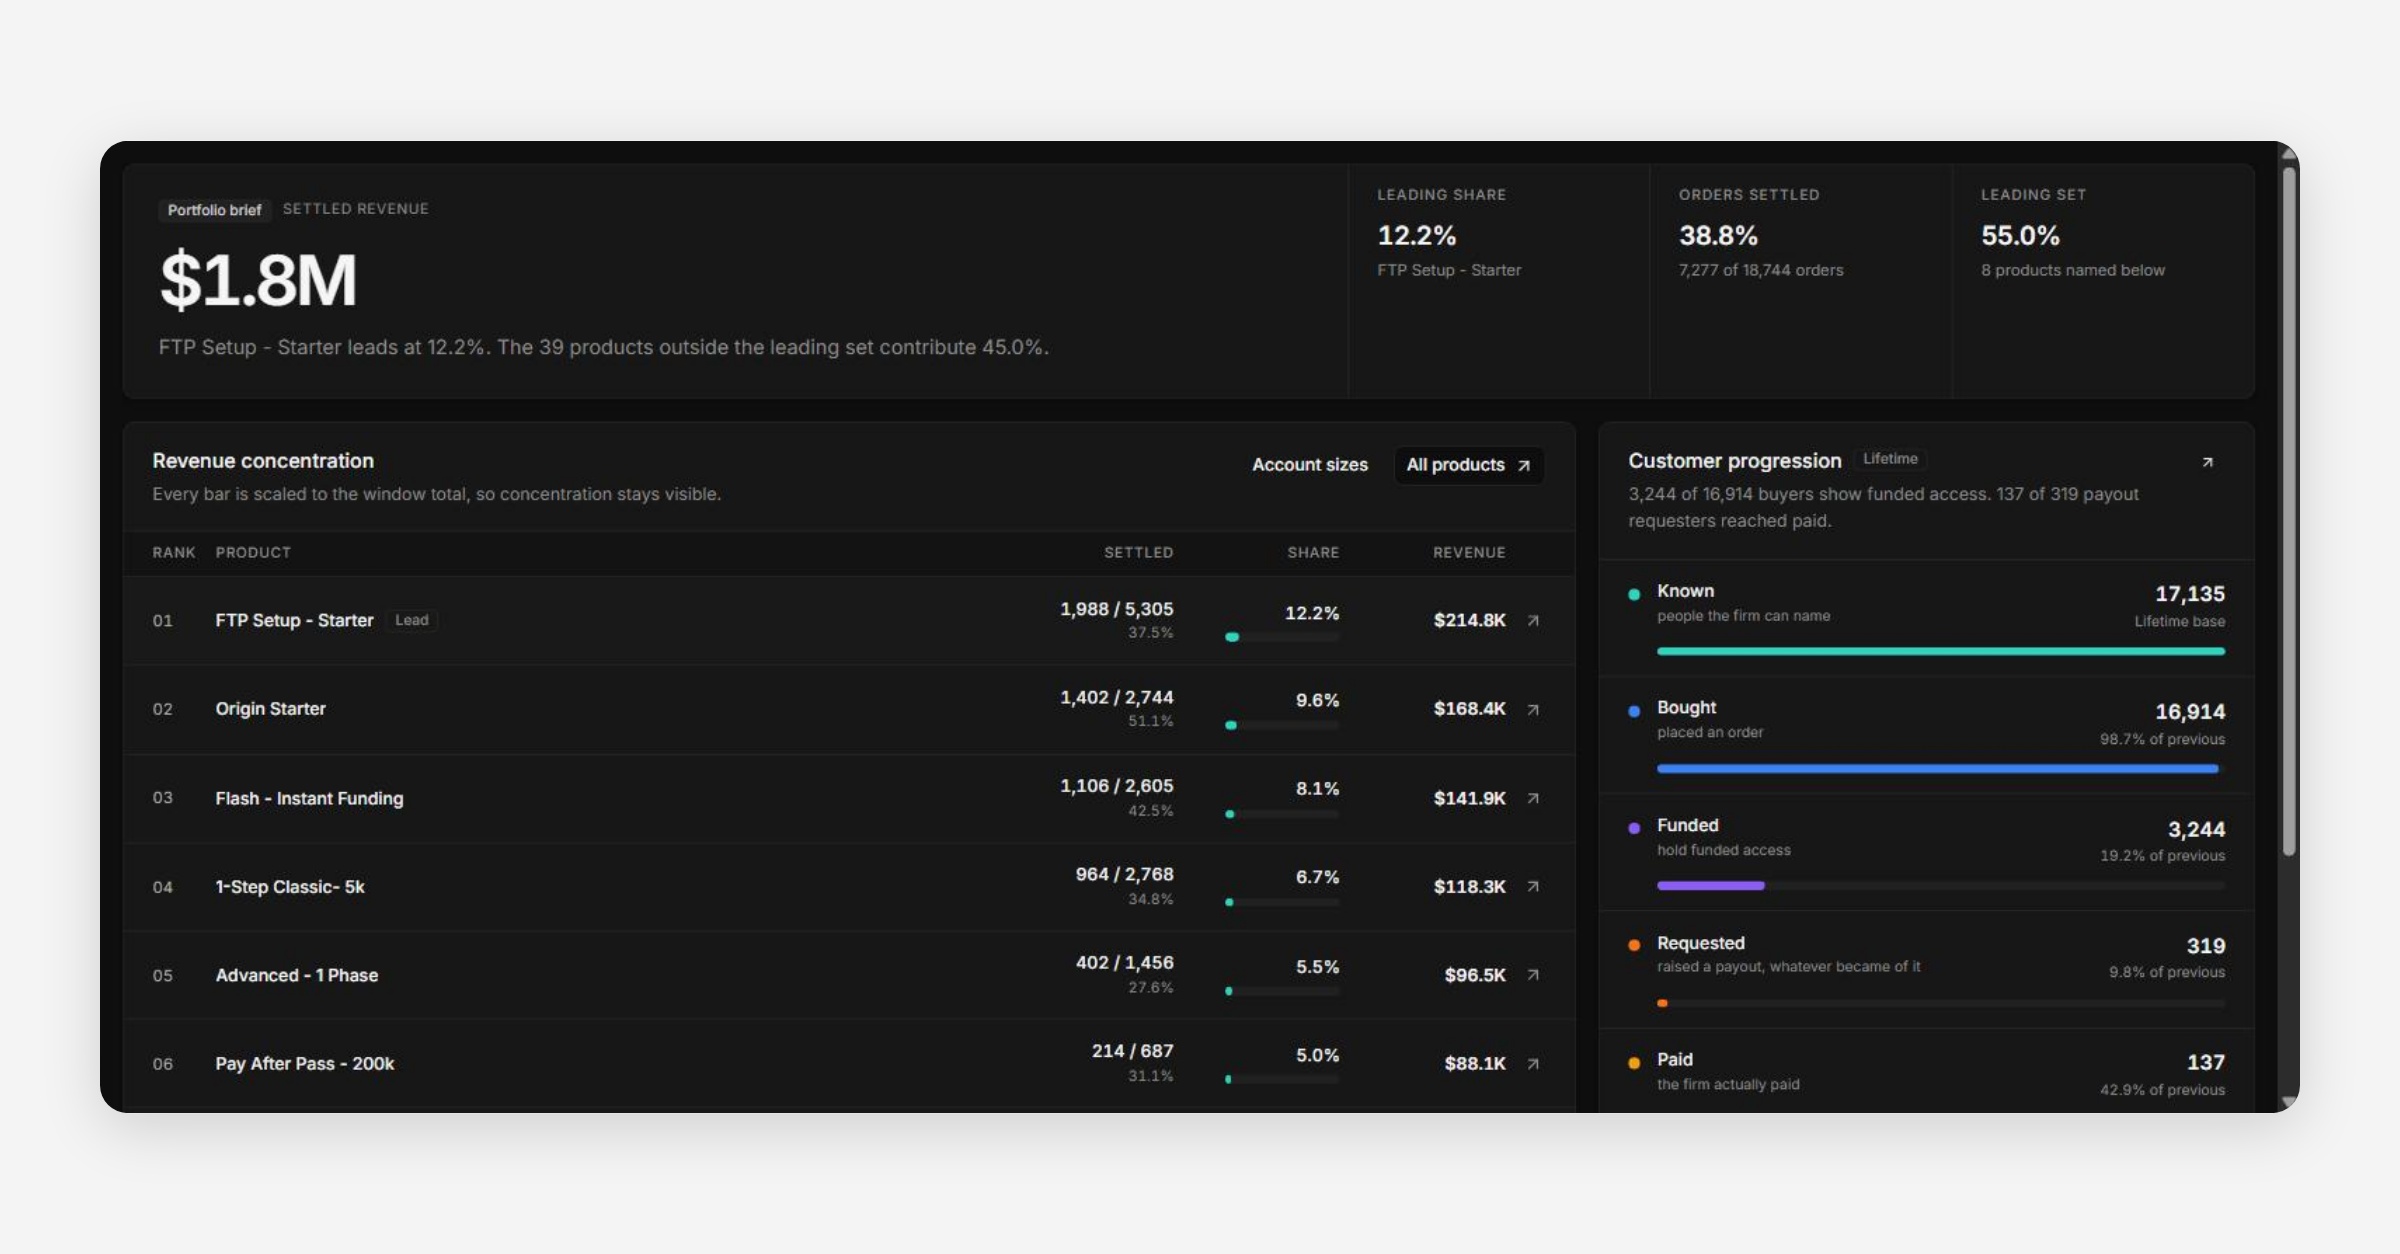
Products shows "what carries settled revenue and how customers progress toward paid payout."
Portfolio Brief
A headline card states settled revenue for the period plus the leading product's share, e.g. "100K 1-Step Challenge leads at 19.7%. The 12 products outside the leading set contribute 13.5%." Three supporting stats — Leading share, Orders settled, Leading set — sit alongside it.
Revenue Concentration
A ranked table of every product by settled orders, share of revenue, and revenue amount, with each bar scaled to the window total so concentration stays visually obvious even as the underlying numbers change period to period. Use "Account sizes" and "All products" to pivot the same data by a different grouping.
Customer Progression
A lifetime funnel — Known → Bought → Funded → Requested (payout) — each stage shown as a count and a "% of previous" conversion rate. This is the fastest way to see where the firm's funnel actually leaks: a large drop from Bought to Funded points at evaluation pass rates, while a large drop from Funded to Requested points at either genuinely satisfied funded traders or a payout-friction problem worth investigating on the Payouts page.
Was this helpful?