
Data Analysis
The self-serve chart builder for any business measure, shareable by URL.
Data Analysis
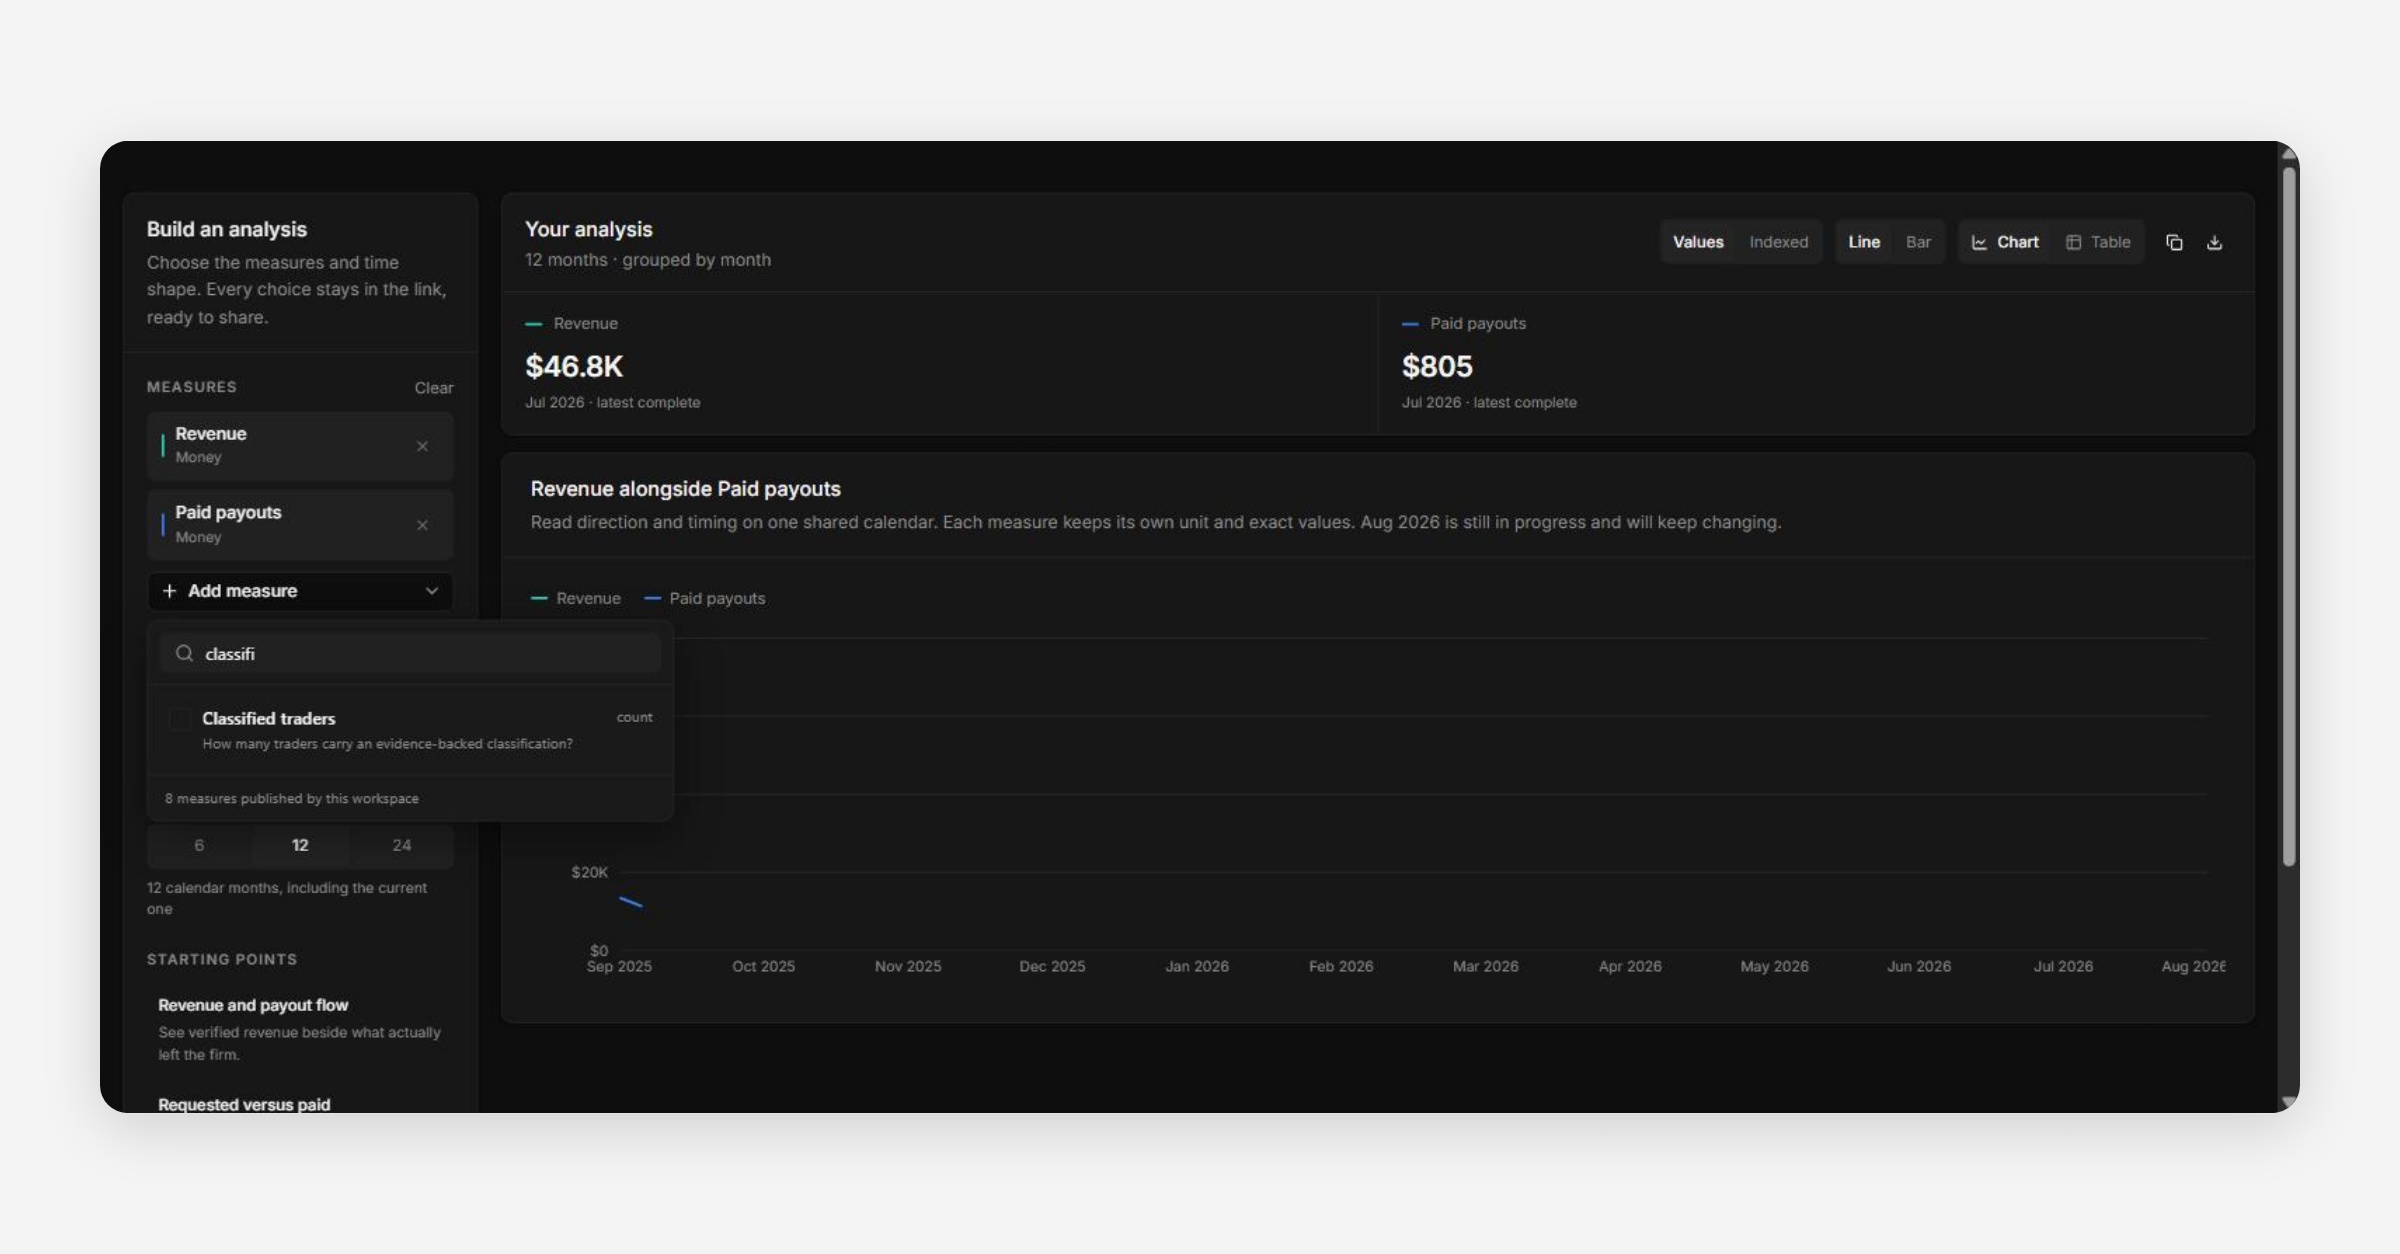
Data Analysis is a self-serve chart builder: "Build a shareable view of trusted business measures over time, then inspect the exact values behind the shape." It's the v2 answer to ad-hoc reporting — instead of exporting to a spreadsheet, you compose the view here and share the link.
Building an Analysis
Control | What it does |
|---|---|
Measures | Add or remove any business measure (e.g. Revenue); each is plotted as its own series |
Group results | Week, Month, Quarter, or Year granularity |
History | 6, 12, or 24 periods back |
Values / Indexed | Raw values, or indexed to the first period (useful for comparing series with different scales) |
Line / Bar / Chart / Table | Visualization type — Table gives you the exact numbers behind the shape |
Starting Points
Pre-built analyses (e.g. "Revenue and payout flow") give you a sensible default view to start from instead of an empty chart.
Sharing
Every selection — measures, grouping, history, view type — is encoded in the URL. Copying and sending that link reproduces the exact same analysis for whoever opens it; no separate "save" step is required. Use the copy-link and download icons in the top-right of the chart panel to share or export.
Was this helpful?