
Firm
Revenue vs. payouts flow, the firm's health score, and how to read the Revenue pace chart.
Firm
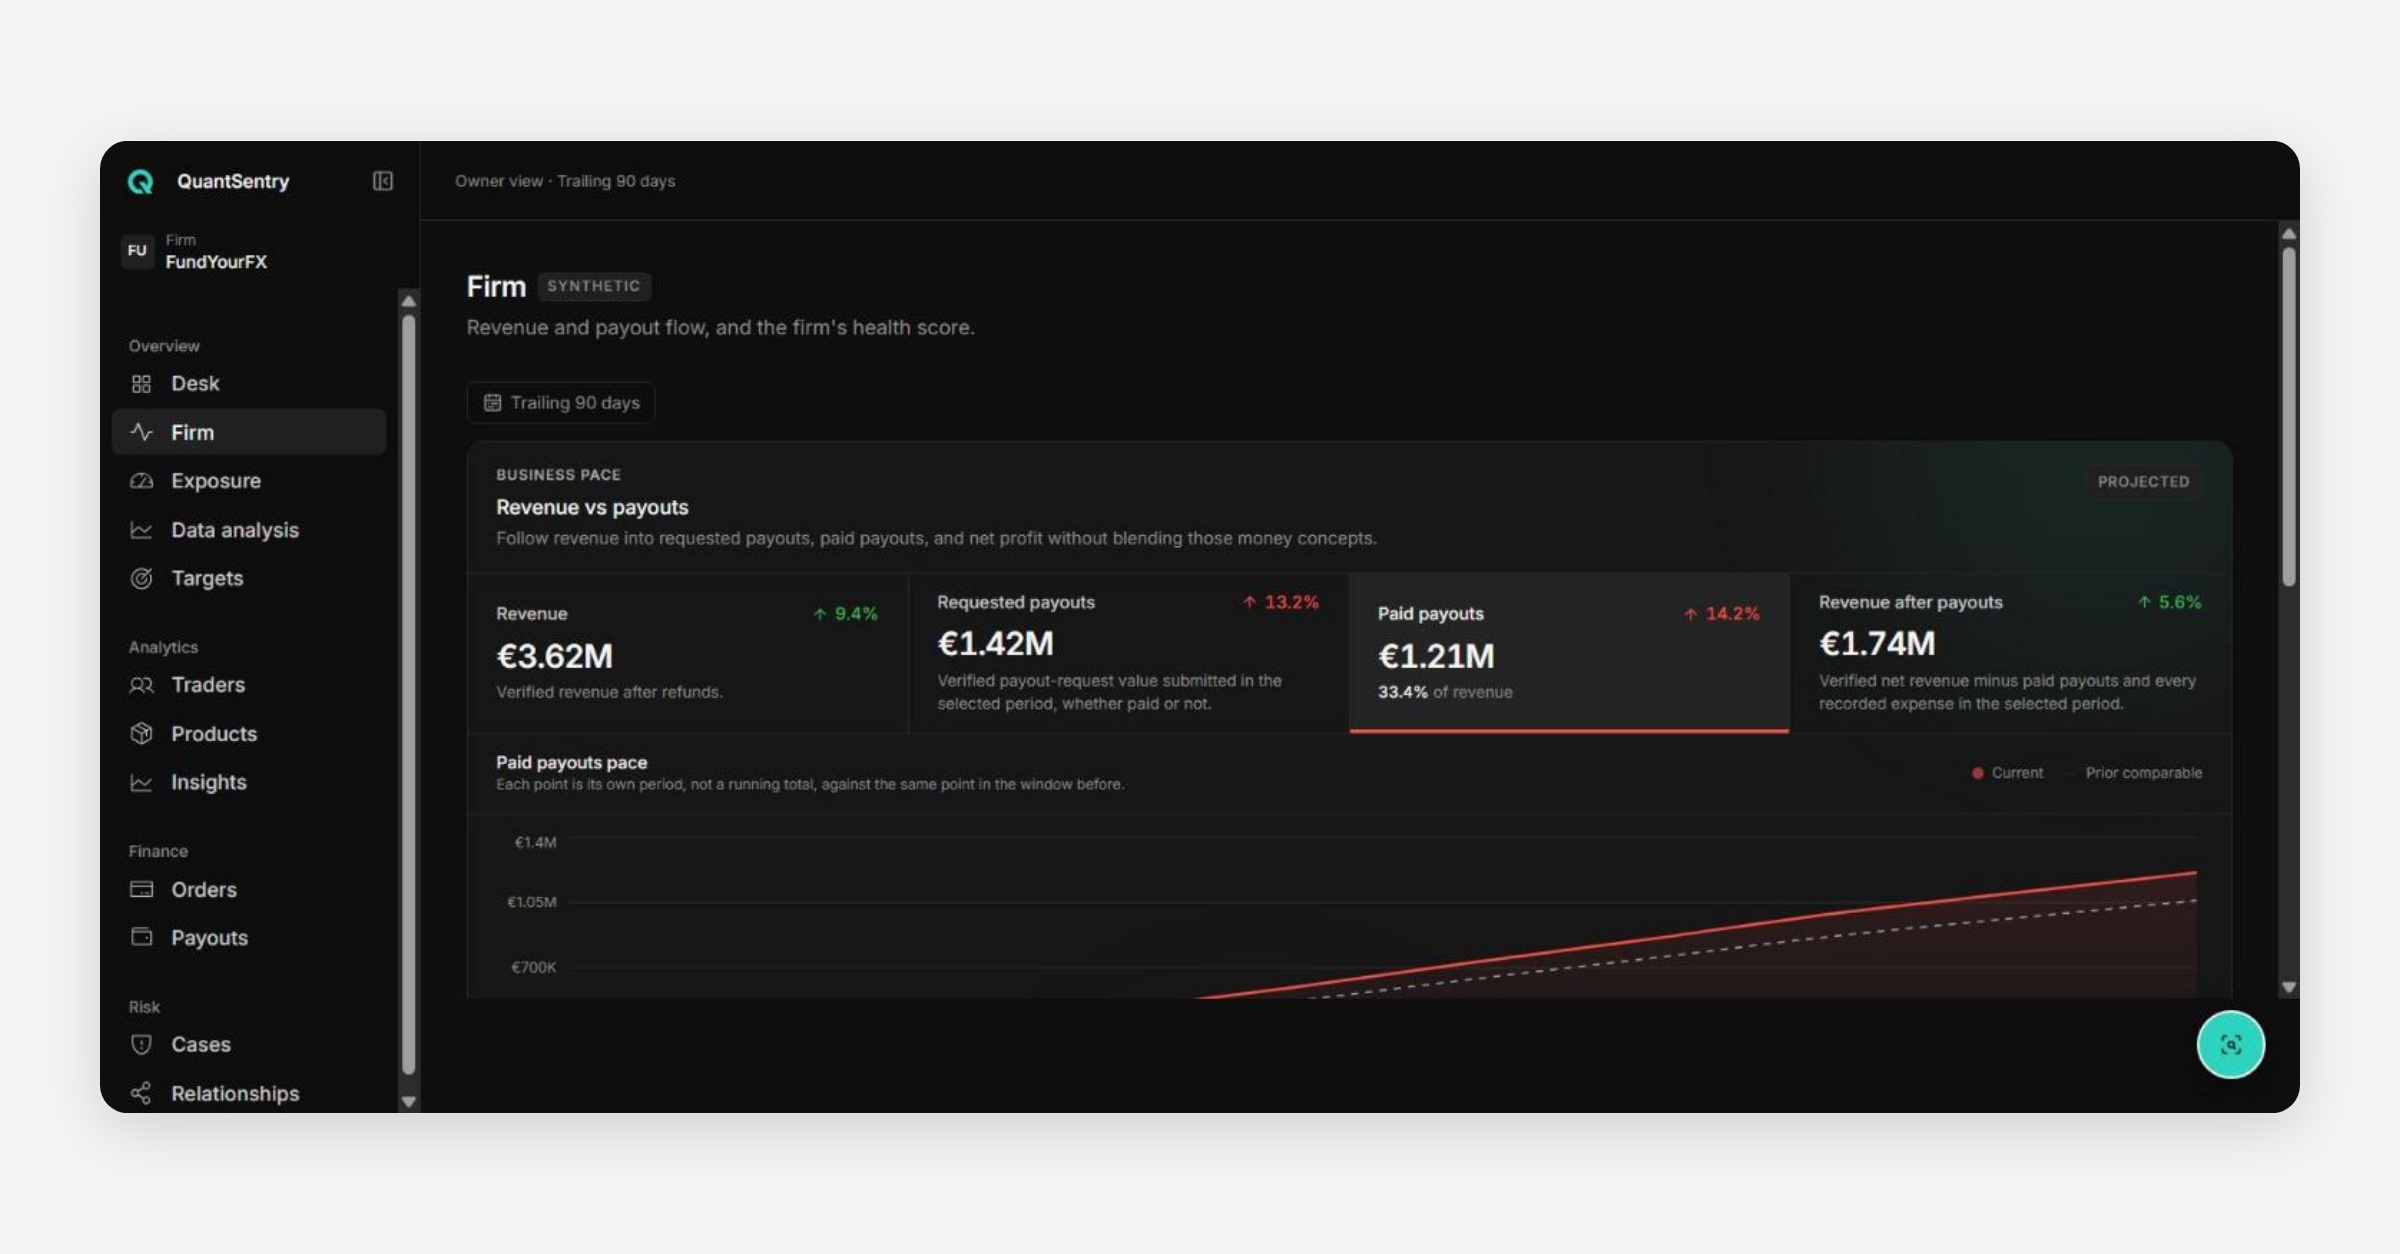
Firm zooms out from Desk's worklist to the firm's overall money flow: "Revenue and payout flow, and the firm's health score."
Business Pace
The "Revenue vs payouts" panel breaks the same top-line revenue figure into four numbers so they're never blended into one another:
Metric | Definition |
|---|---|
Revenue | Settled product orders, net of discounts |
Requested payouts | Every payout a trader requested, whatever it was resolved to (paid, rejected, or still pending) |
Paid payouts | What actually left the firm, and what share of revenue that represents |
Revenue after payouts | Revenue minus paid payouts — the firm's actual retained take |
This separation matters: a firm can have a healthy revenue after payouts while its requested-payout total looks alarming, because most requests haven't been approved yet. Read Requested and Paid as two different questions — demand vs. actual outflow — not as a funnel.
Revenue Pace
A line chart plotting the current period against the prior comparable period, point by point (each point is its own period value, not a running total). Use it the way v1's guide to understanding risk trends recommended reading the risk trend: a sudden divergence from the prior-period line is worth investigating same-week, not at month-end.
Customize
The "Customize" control in the top right lets you adjust which panels appear on this page.
Was this helpful?