
Metrics
Metrics is the settings page that shows the governed definition behind every number QuantSentry reports, and lets a firm define its own measurements on top of that catalog. It answers which measurements this firm can use, and exactly how each one is calculated.
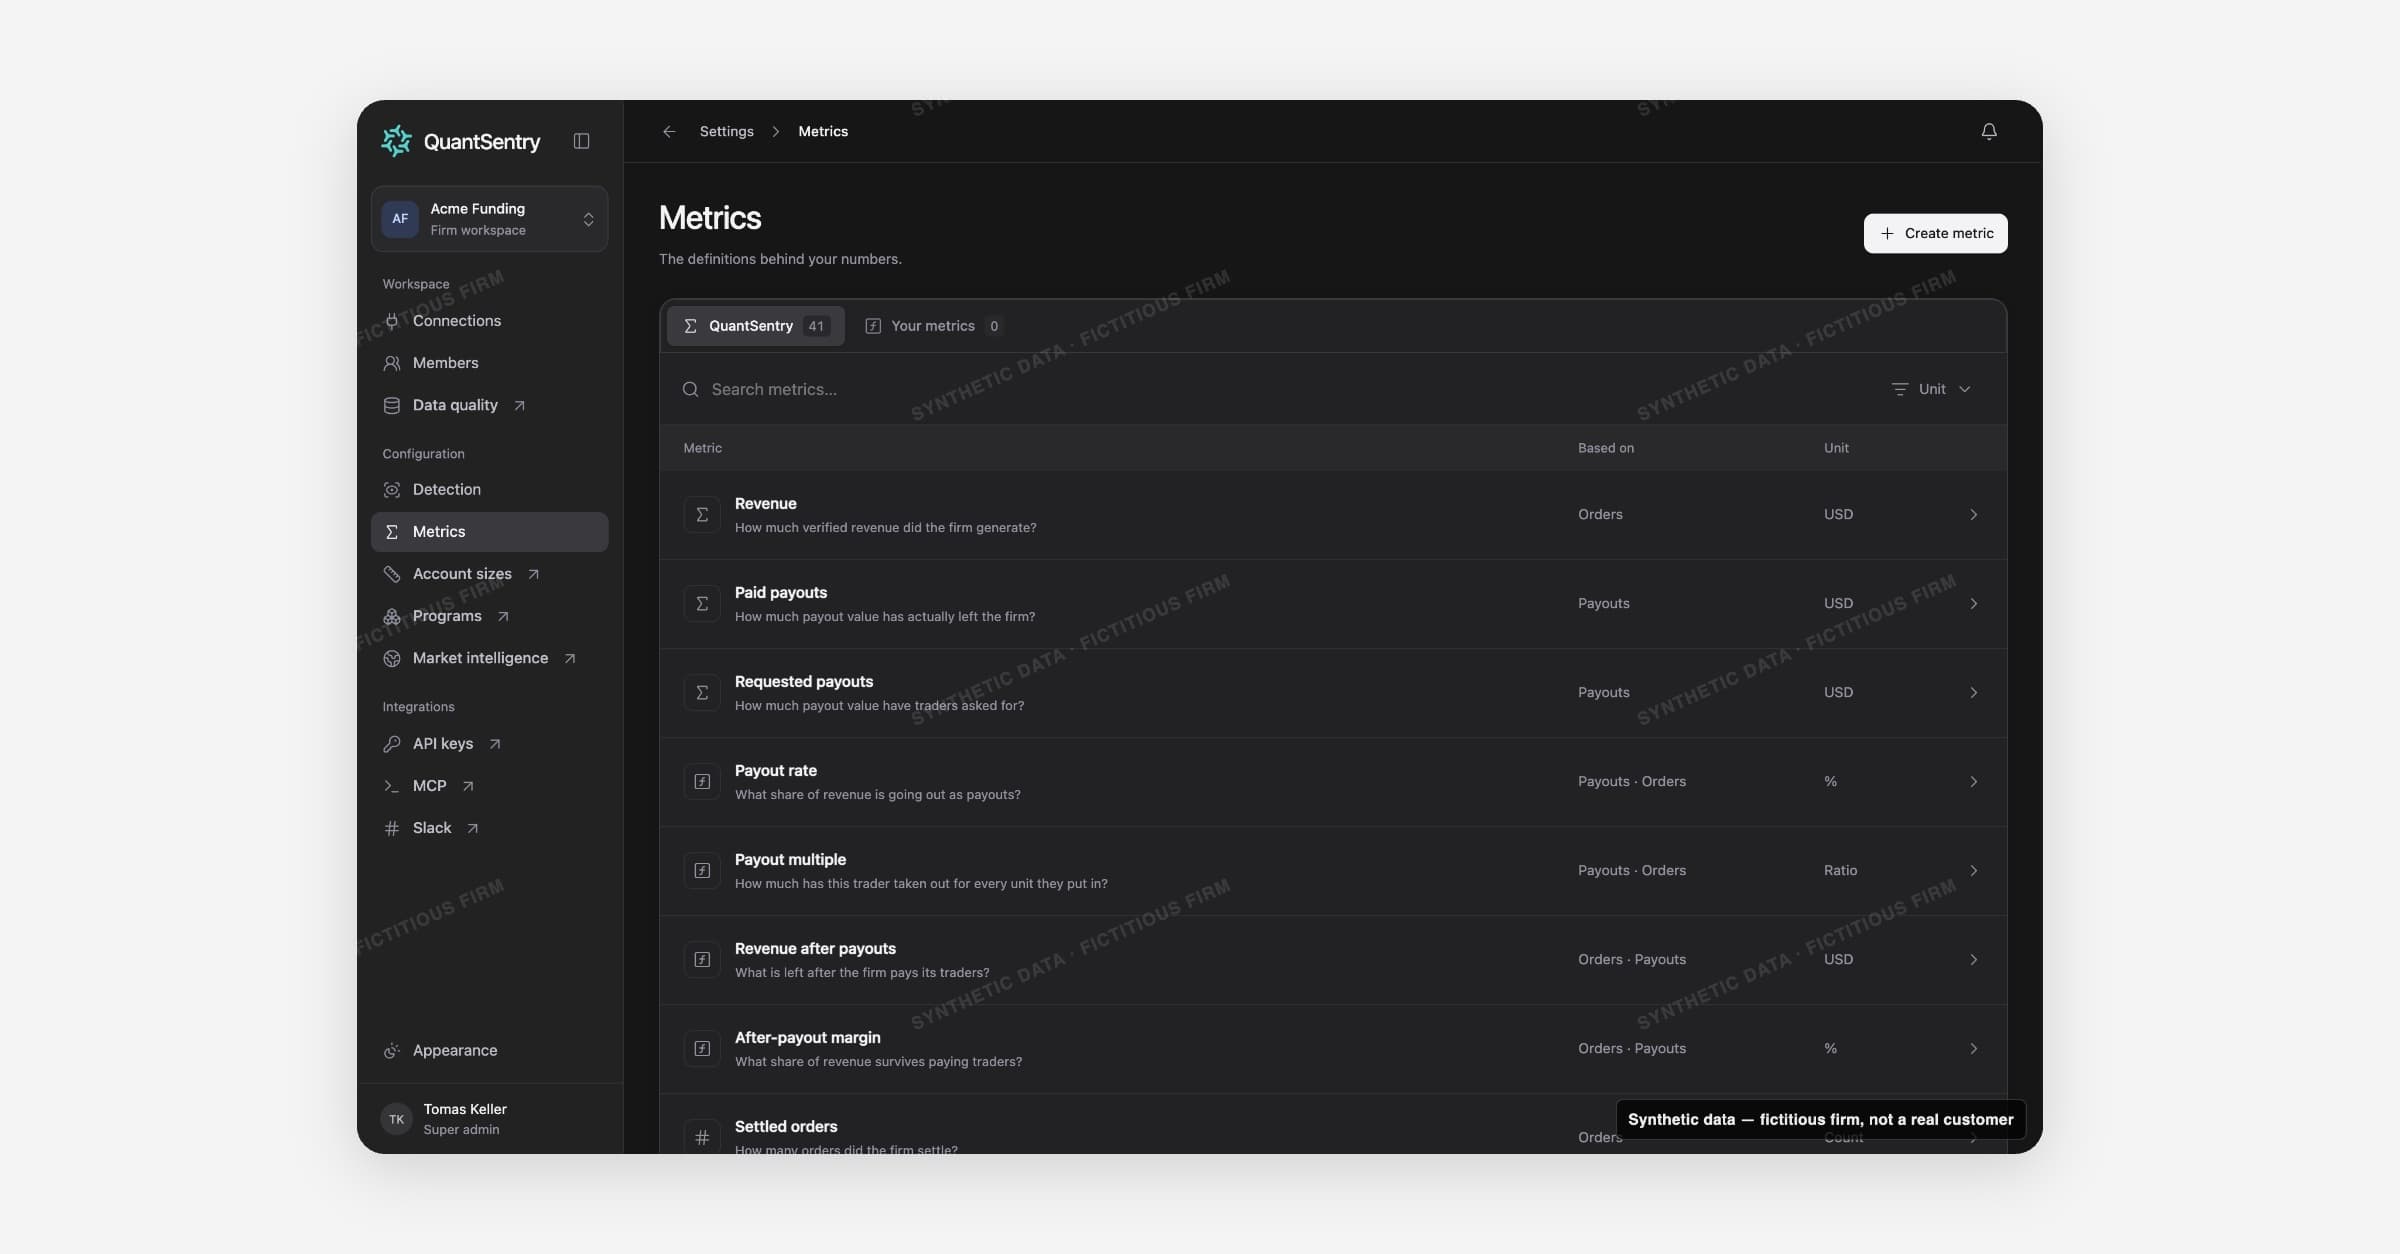
[SCREENSHOT: 15-metrics.png: Metrics catalog showing the QuantSentry and Your metrics tabs with the Metric, Based on, and Unit columns]
The metric catalog
Metrics has two catalogs. QuantSentry holds 41 canonical metrics that are read-only: revenue and order metrics, payout metrics, firm economics (payout rate, margin), acquisition, trading activity, identity and classification, per-trader commerce, and the value QuantSentry itself protects. Your metrics holds whatever the firm has authored on top.
Search by name, source, or unit, or filter to a single unit (Money, Count, Percentage, Ratio, Days). Each row shows the metric's name and the question it answers, what it's based on, and its unit. The footer marks whether a metric is Defined by QuantSentry (read-only) or Defined by your firm.
Reading a metric's definition
Opening a metric shows what it measures and how:
- Question it answers and a plain description of the metric.
- Interpretation: whether higher is better, lower is better, or the metric is best read within a range.
- Time scope: the selected reporting period, or all recorded history for lifetime metrics.
- Calculation: for a derived metric, the two metrics it combines and the operation (division, subtraction, or a percentage); for a record-based metric, the aggregation (a count, a total, or the largest value) and any filter applied.
- Defined by, plus a metric ID and version, so a formula change is traceable over time.
A few metrics carry a built-in caveat where it matters: profit metrics (revenue after payouts, after-payout margin) note plainly that no expense source is connected yet, so they exclude costs and overstate profit. Any ratio shows No result rather than a misleading number when its denominator is zero.
A metric can also carry a Case condition: Create a Case when this measurement crosses a threshold, set above or below a value over a measurement window. Crossing that threshold opens one Case; it does not keep creating new Cases while the condition stays true.
Creating your own metric
Create metric starts with what you want to understand: a name, the question it answers, and an optional description. From there, choose a calculation type:
- From records: count a set of records, total a numeric field, or take the largest value, optionally filtered to matching values (for example, only settled orders).
- From two metrics: combine two existing metrics as a percentage of one another, a subtraction, or a straight division.
Set the metric's interpretation (higher or lower is better, or a range) and its basis (adds up over the period, a current position, a rate, or a trend). A review step shows the resulting unit and calculation before saving; it does not compute a live value, run a query, or create a Case on its own. Canonical metrics can never be edited or deleted, and a custom metric already used by another metric or by a Case condition has to be unlinked first.
How it connects
Metrics is the shared source for measurements used across the product: Detection uses any trader-eligible metric as a classification rule or through the Catalog metric detector, and Connections determines which source feeds a given metric. Definitions here also back the numbers shown on Overview and Business performance.