
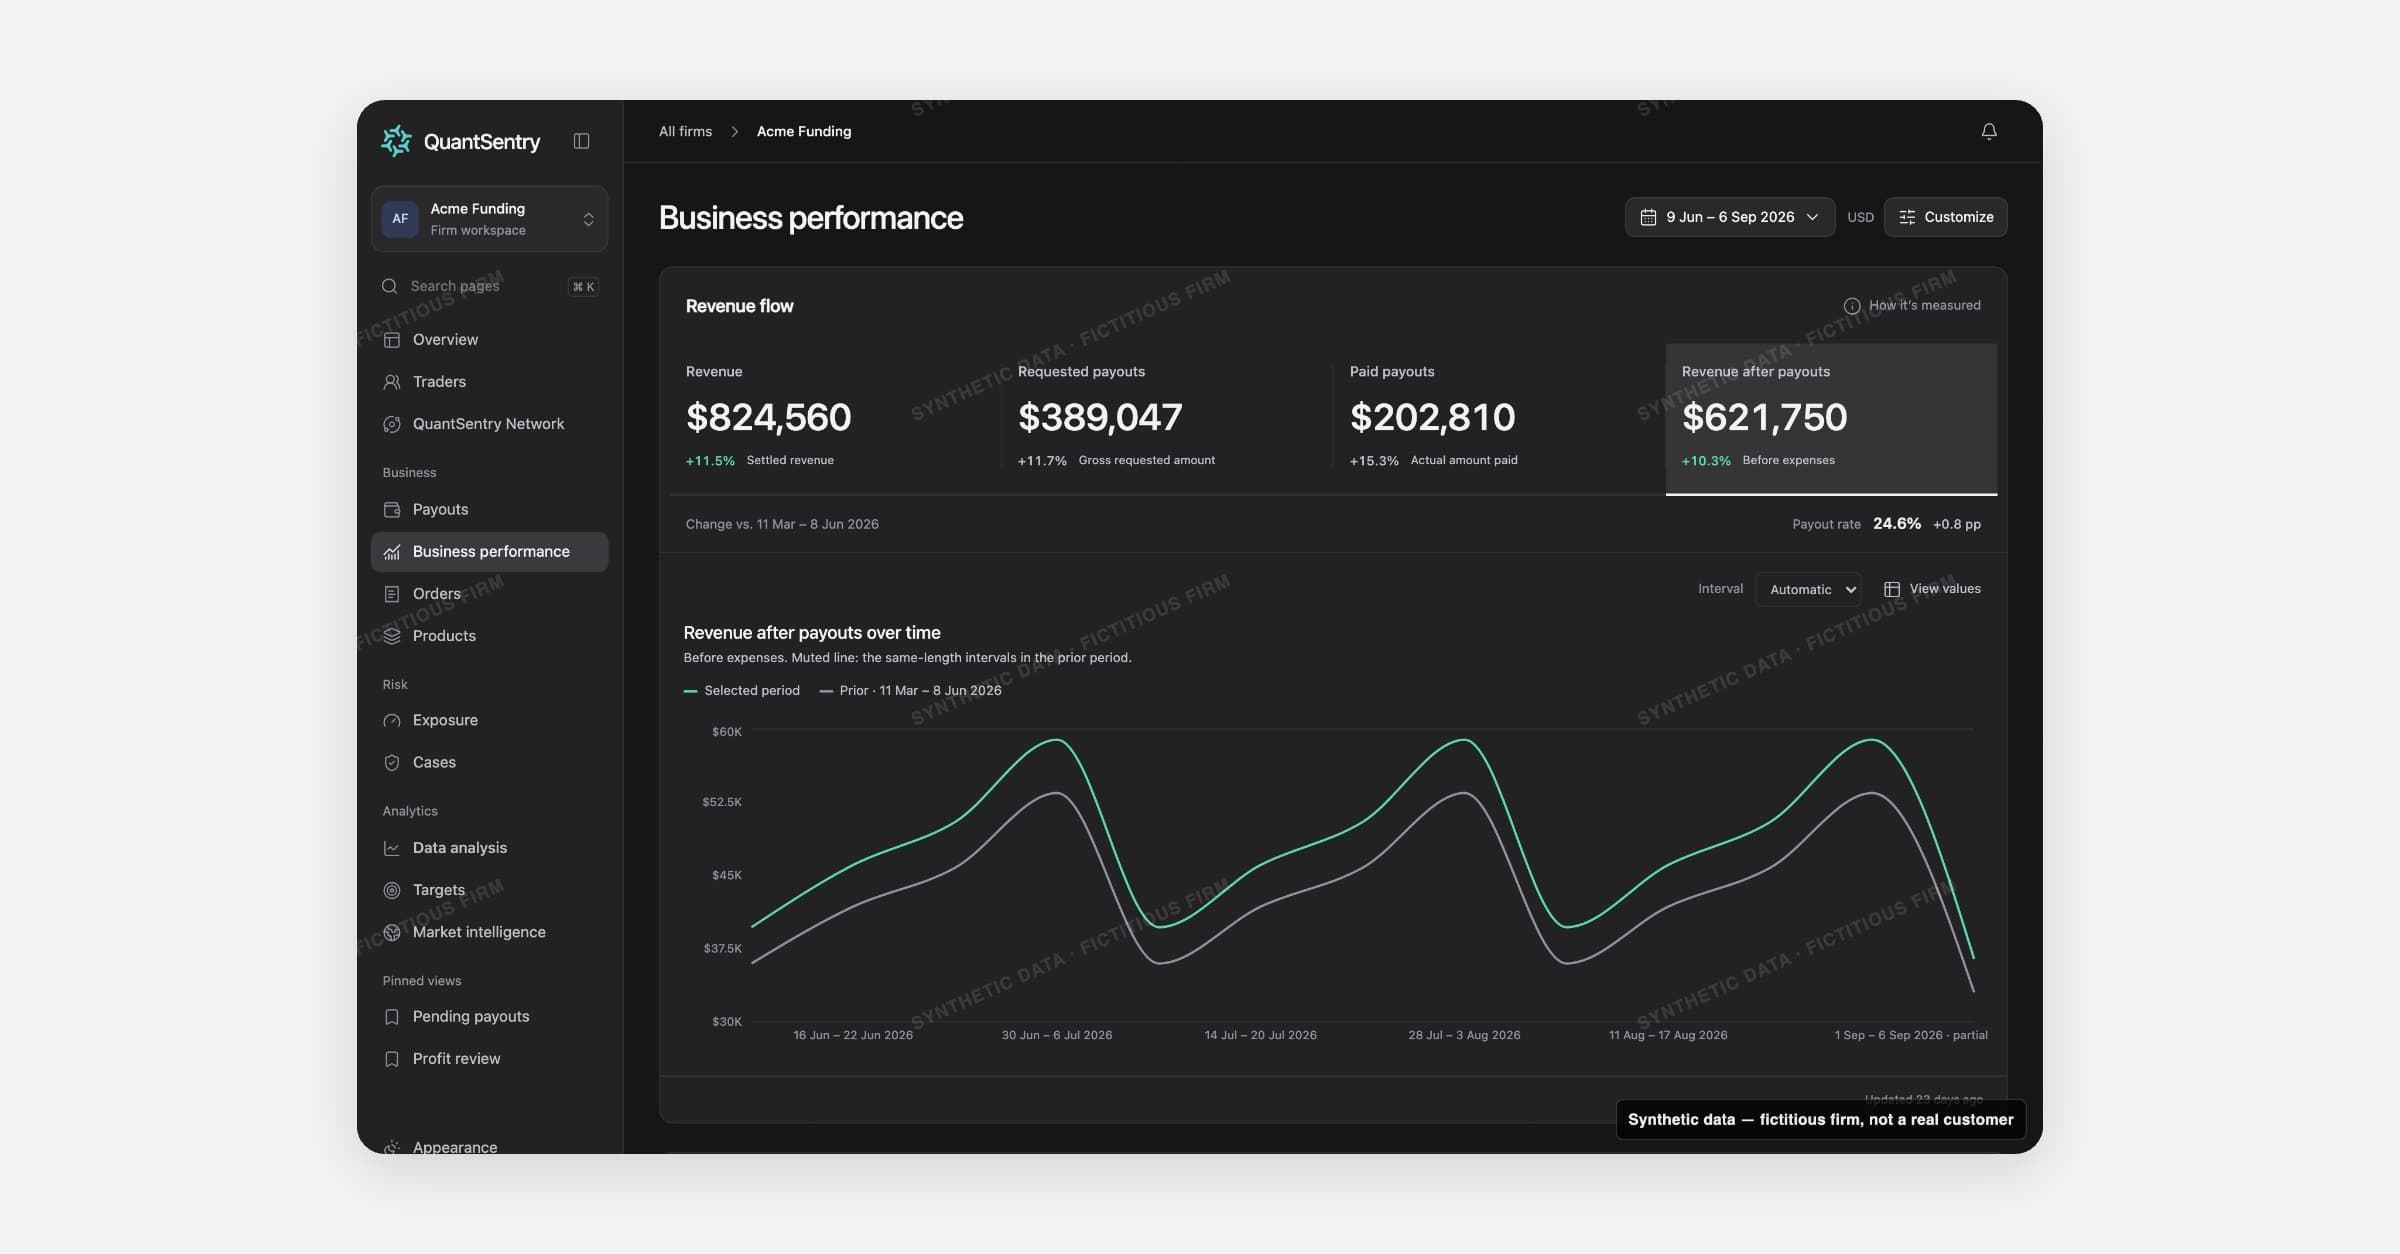
Business performance is the firm's historical financial dashboard: it answers whether revenue is turning into healthy retained value, tracked over time and against the prior period. It's kept separate from the operational work on Overview, Cases and Payouts, since the business's overall health is a different question from what needs attention today.
Revenue flow
Four measures sit at the top of the page as selectable tiles. Clicking one switches the trend chart below it. Revenue after payouts is selected by default.
Measure | What it shows | Opens |
|---|---|---|
Revenue | Settled revenue in the selected period | Orders |
Requested payouts | Gross amounts traders requested, before their profit split. Never subtracted from revenue | Payouts |
Paid payouts | Actual amounts paid out, after the split | Payouts |
Revenue after payouts | Revenue minus paid payouts. Before operating expenses, not net profit | Products |
Each tile shows a change badge against the prior period of equal length. Revenue and Revenue after payouts are colored higher-is-better; Requested and Paid payouts carry no good or bad coloring, since a payout amount isn't good or bad on its own. A payout rate readout (paid divided by revenue) sits alongside, also uncolored.
The chart plots the selected measure against the same-length prior period, at an automatic, weekly, or monthly interval. If the firm's recorded history doesn't reach back far enough for the selected window, the chart shows an empty state rather than a partial or estimated line. Use View values to see the exact numbers behind the chart in a table.
Health Score
Health Score scores the firm's revenue quality and payout balance on a scale with a low band below 34, watch from 34, and healthy from 67 up. It's computed on the server from real business records, not estimated in the browser.
Three signals contribute: Average order value (verified revenue divided by settled orders), Payout rate (paid payouts divided by revenue), and Accounts opened. Each scored signal shows its value, its score, and how it compares with a reference. A signal without a usable comparison is listed as missing rather than dropped silently, and the page states how many of the three signals were actually scored. A custom date range doesn't get a Health Score, since scoring needs a comparable preset window.
Product contribution and customizing the page
A ranked table breaks the period's revenue after payouts down by product, alongside each product's revenue, paid payouts and payout rate, with a change badge on revenue after payouts. Rank by revenue after payouts, revenue, or paid payouts.
Revenue flow always stays at the top of the page. Use Customize to turn the Health Score and Product contribution sections on or off; the layout is saved for the firm until the browser reloads.
How it connects
Orders and Payouts are where the Revenue and payout method dialogs link out to the underlying transactions. Products shows the full product list behind Product contribution, and Targets carries the firm's own goals and pace, tracked separately from this historical view.