
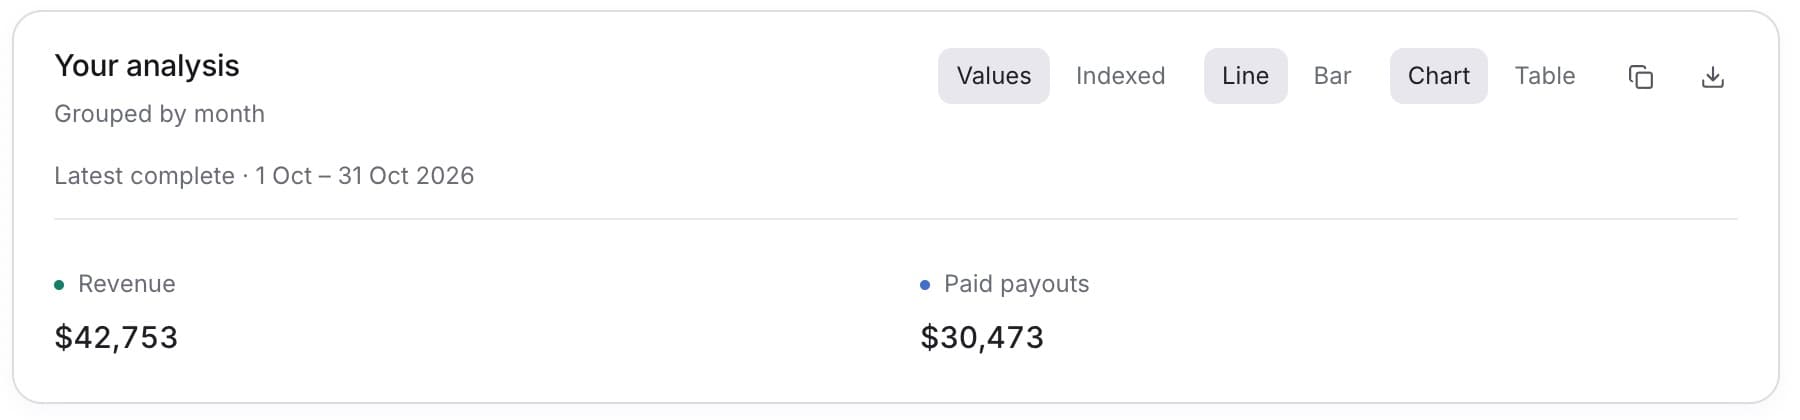
Build a chart of one or more measures and send the exact view to a teammate as a link. Any workspace member can do this.
- In the sidebar, select Data Analysis.
- To start from an empty chart, select Clear next to Measures.
Tip: To start from a ready-made pair instead, select one of the Starting points, for example Revenue and payout flow, and go to step 6.
- Select Add measure.
- Type in the search box, then select a measure from the list.
Tip: The search matches measure names and the questions they answer. Up to 4 measures are drawn at once.
- Repeat steps 3 and 4 for each measure you want to add.
- Under Group by, select Week, Month, Quarter or Year.
- Under History, select 6, 12 or 24.
- In the Your analysis panel, select Chart to see the shape or Table to see the exact values.
- Select Copy analysis link (the copy icon in the Your analysis panel), then paste the link where you want to share it.
Tip: To keep the values in a spreadsheet, select Download analysis as CSV (the download icon) instead.
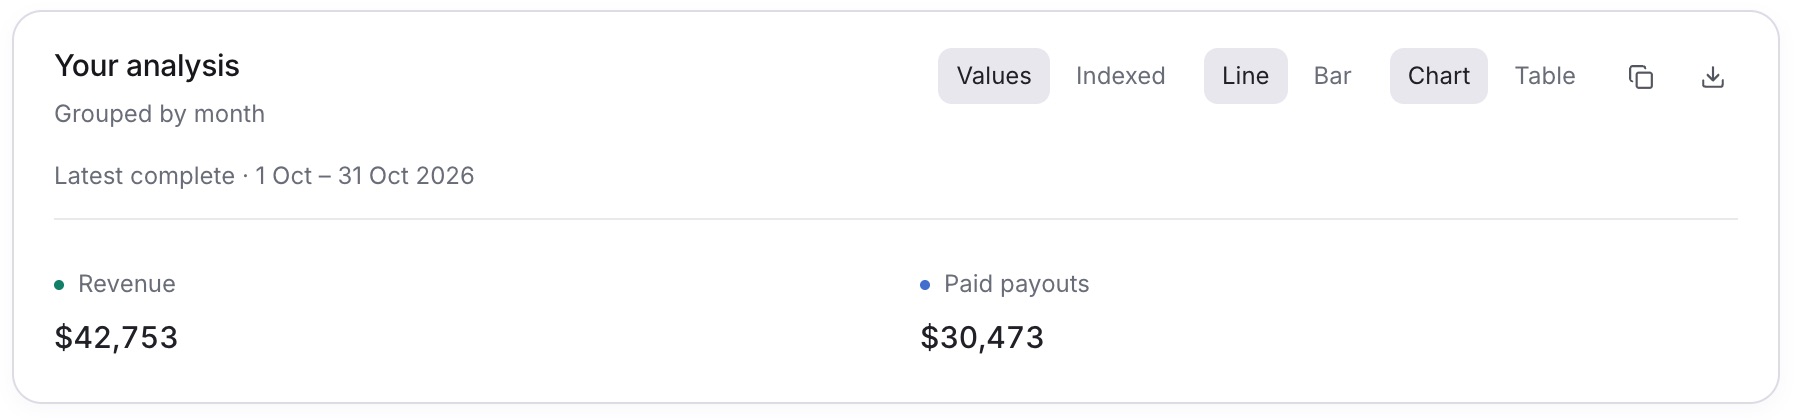
Result: The page announces Analysis link copied. Anyone in your workspace who opens the link sees the same measures, interval, history and view.
To remove a measure, select the remove button on its chip under Measures (for example Remove Revenue).