
QuantSentry changelog
Prop firm business metrics, defined once so payout rate and margin never disagree
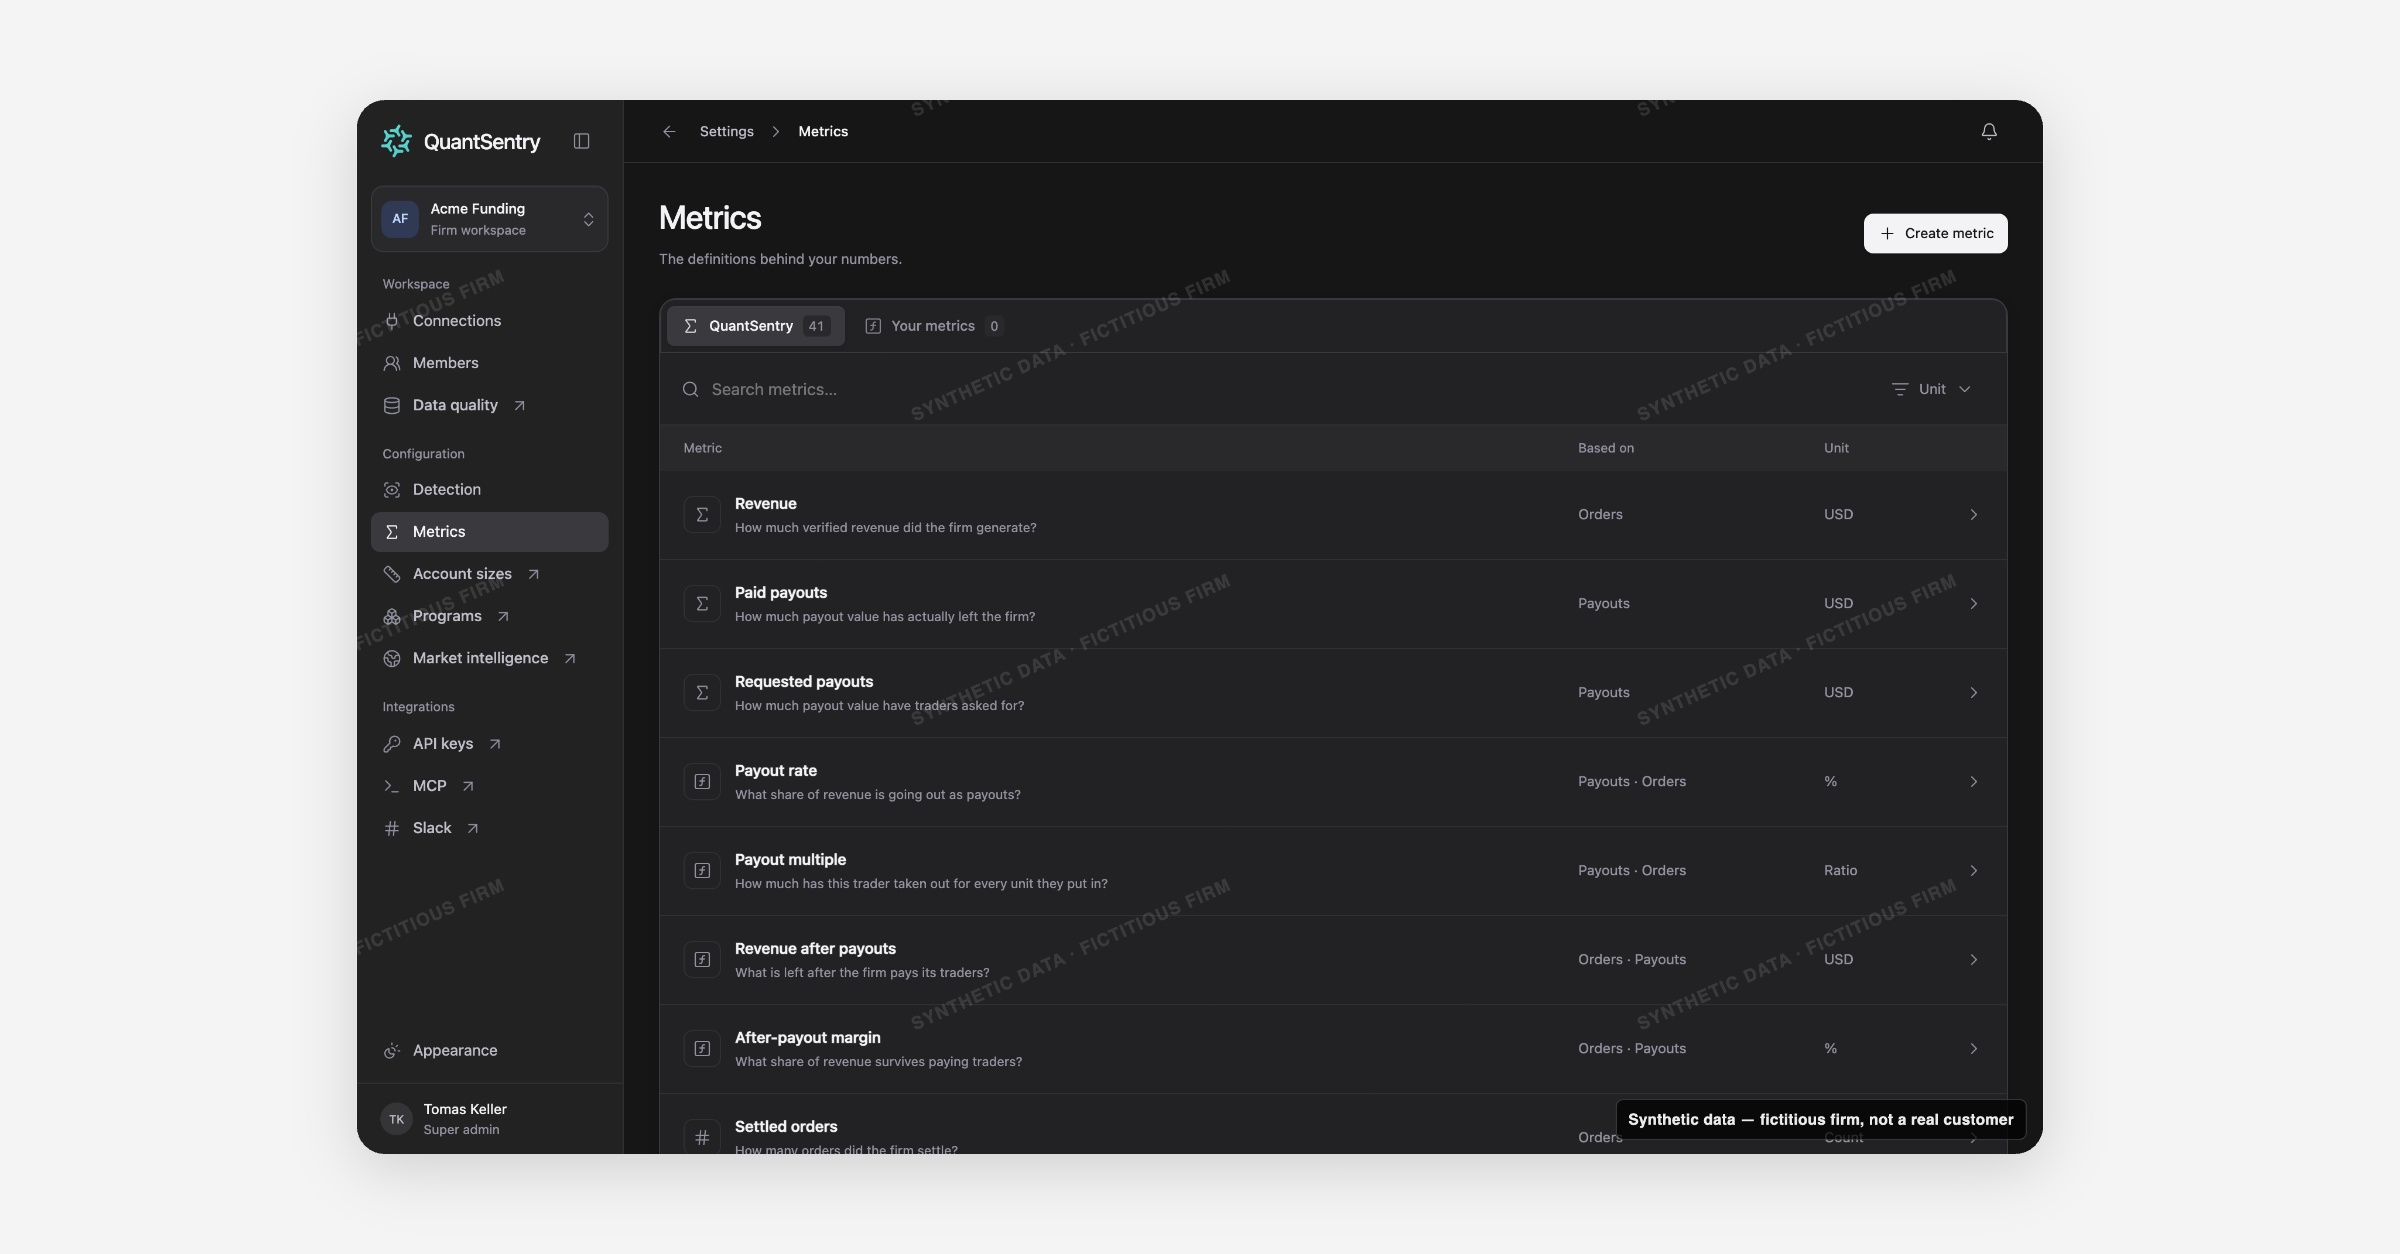
QuantSentry's Metrics catalog, now previewable in the QuantSentry workspace, gives every number a single governed definition, from payout rate to margin, plus the ability to author your own firm-specific measurements.
Screenshot uses synthetic example data from a fictional firm ("Acme Funding"). No real customer or trader data is shown.
What's new
The new Metrics page under Settings publishes the exact definition behind every number QuantSentry reports.
Two catalogs sit side by side: QuantSentry, 41 canonical, read-only metrics covering revenue, payouts, firm economics, acquisition and trader classification, and Your metrics, where a firm authors its own.
Every metric opens to a detail page with the Question it answers, its Interpretation, its Time scope and the source records behind it.
A metric derived from two other metrics shows its formula as clickable operands you can open; a metric built directly from records shows it as a plain sentence, for example "Total paid amount (USD)."
Why it matters
A payout rate or a margin figure is only useful if two people looking at the same dashboard agree on what it means.
QuantSentry now states, for every metric, exactly what data feeds it and what it leaves out.
Profit and margin metrics carry an explicit note that no expense source is connected yet, so they exclude costs rather than quietly overstating profit.
A risk analyst can also author firm-specific measurements, such as a refund share, and attach a Case condition so a threshold breach opens one Case, not a flood of duplicates, without engineering support.
This turns trader behavior analytics and prop firm risk management into something built on a shared, checkable definition instead of a spreadsheet everyone edits differently.
What you can do with it
Browse the QuantSentry and Your metrics tabs, filtered by unit (Money, Count, Percentage, Ratio, Days)
Open any metric to see its Question it answers, calculation and Time scope
Create a custom metric From records (count, total or largest value) or From two metrics (percentage of, subtract, divide by)
Set a Case condition so a metric crossing a threshold opens a Case automatically
See honest notes on incomplete data, such as profit metrics excluding costs, before trusting a number
How it fits with the rest of QuantSentry
Metrics is the definition layer behind Overview, Business performance, Payouts and Orders, and the same catalog feeds classification rules in Detection.
Exploring how these numbers move over time is a separate, upcoming view.