
QuantSentry changelog
A prop firm business dashboard that separates revenue, payouts, and true retained value
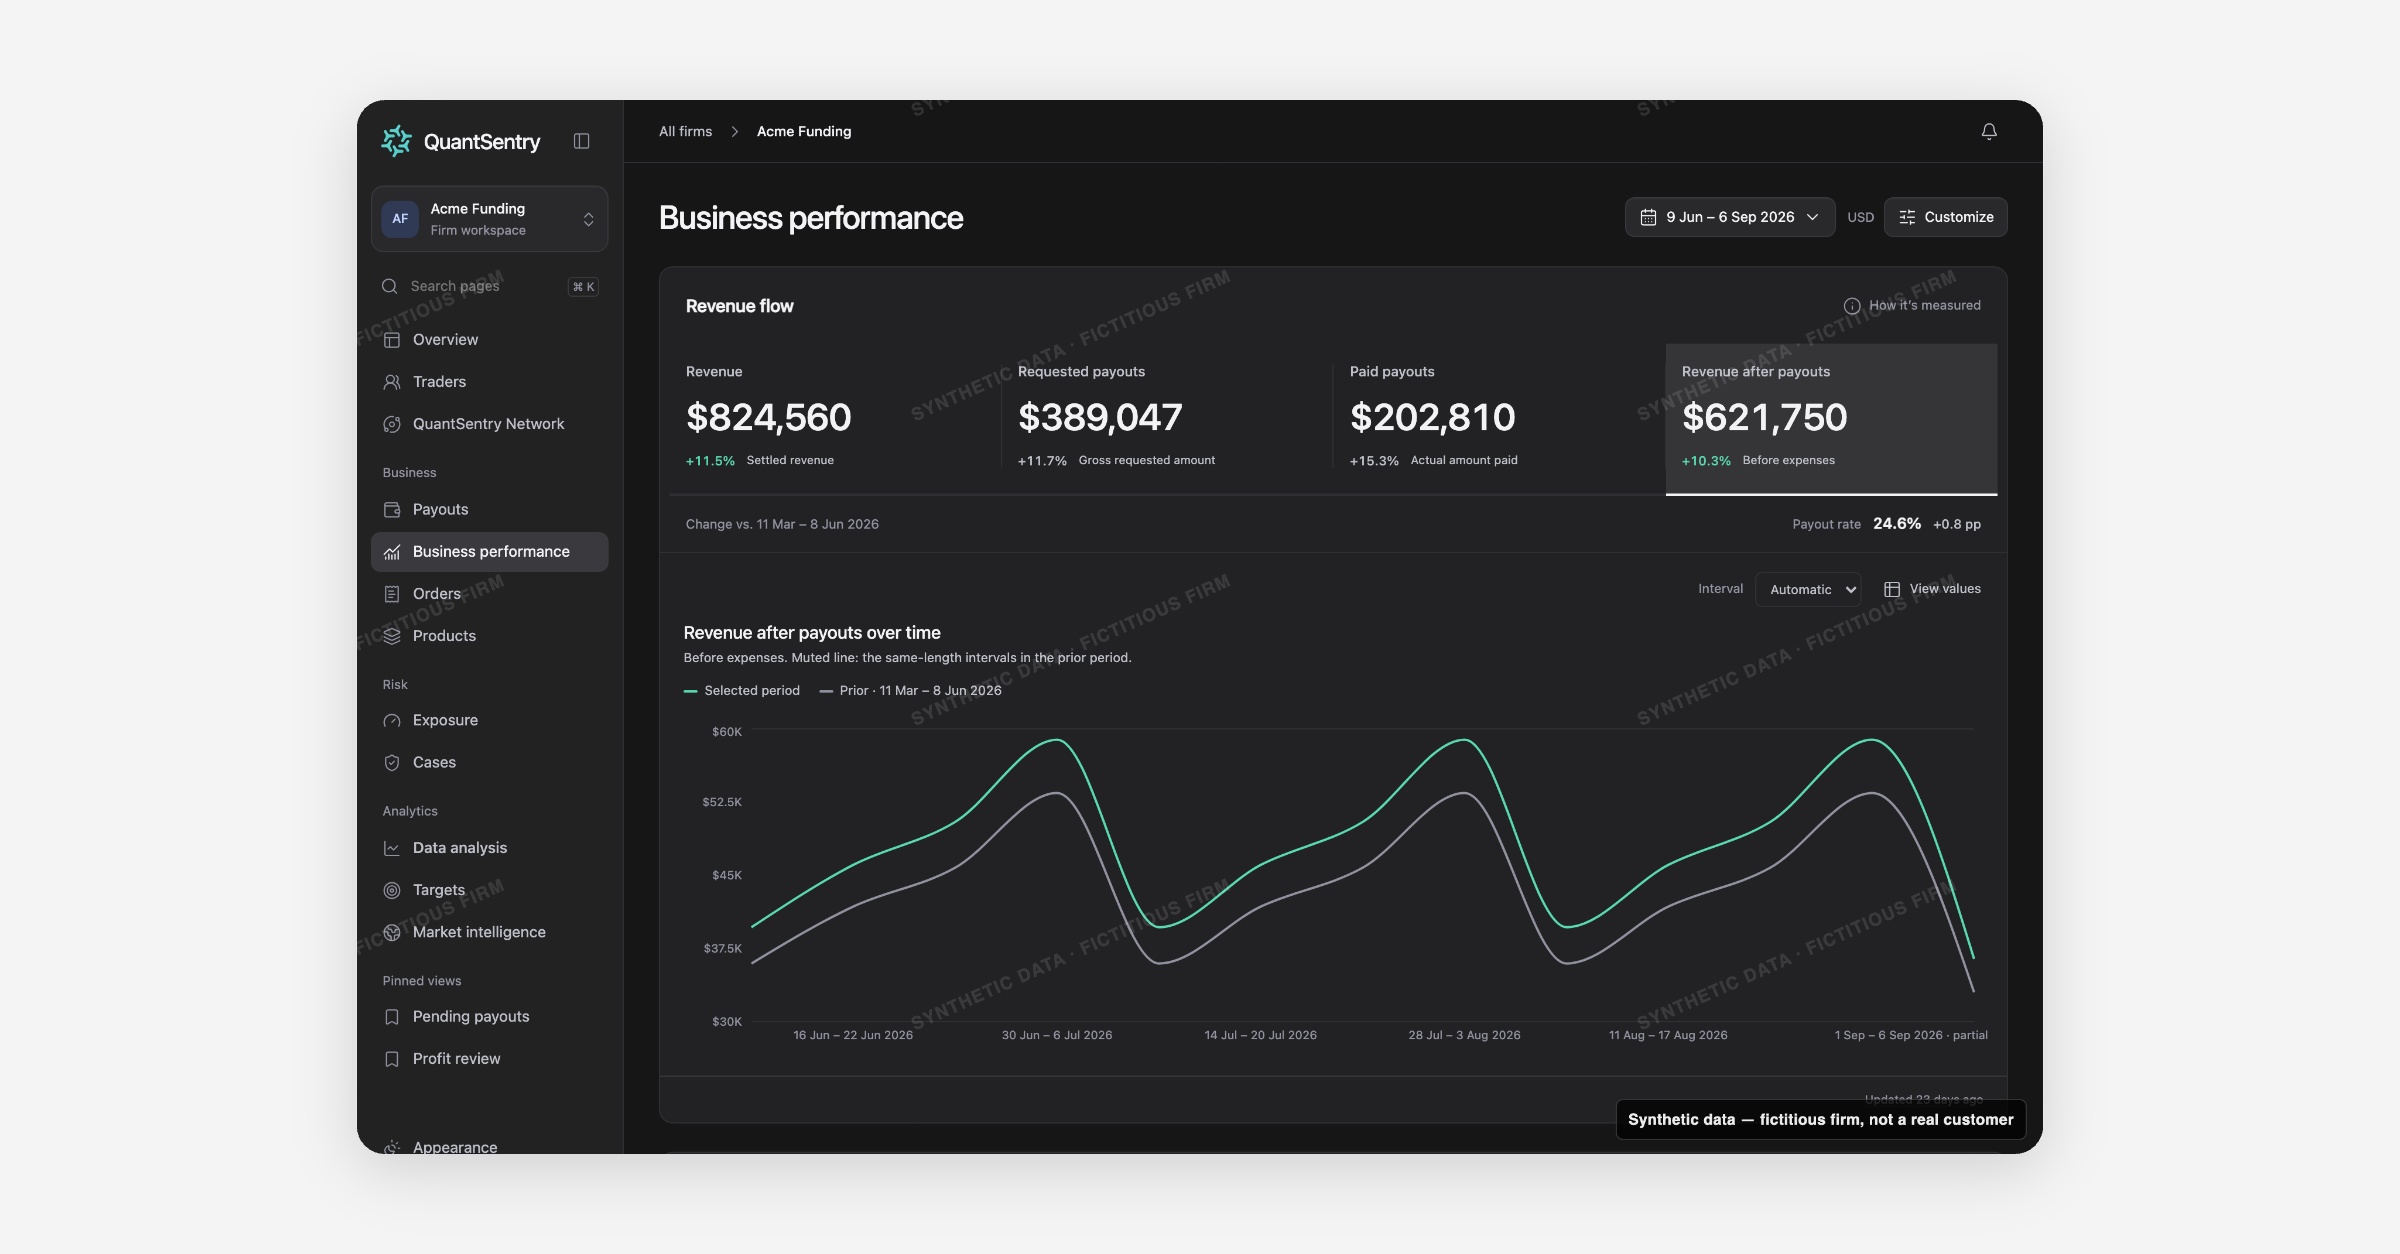
Business performance now shows settled revenue, requested and paid payouts, and revenue after payouts on one page, plus a Health Score that grades your pace against a benchmark, so you can see whether sales are turning into money you actually keep.
Screenshot uses synthetic example data from a fictional firm ("Acme Funding"). No real customer or trader data is shown.
What's new
Business performance (formerly called Firm) is now previewable in the QuantSentry prototype workspace.
The page opens on Revenue flow: four measure tiles, Revenue, Requested payouts, Paid payouts, and Revenue after payouts, each with its own trend chart and a comparison against the immediately preceding period of equal length.
Below it, an optional Health Score section scores signals such as average order value and payout rate against a reference benchmark, and a Product contribution table breaks revenue and payouts down by product.
The Health Score itself already runs on the same scoring engine now live in your QuantSentry workspace, so the numbers you preview here are not a mockup.
Why it matters
Owners and finance teams usually assemble this picture by hand: revenue from a commerce platform, payouts from a separate tool or spreadsheet, then a manual reconciliation.
That invites two common mistakes this dashboard is built to prevent: treating gross requested payouts (before a trader's profit split) as if they were money already paid out, and calling revenue minus payouts "profit" when it is still before operating expenses.
Business performance labels Revenue after payouts with the caption Before expenses everywhere it appears, and keeps requested and paid payouts as separate, clearly named measures.
For a prop firm business dashboard, that distinction is the difference between a real read on retained value and a number that only looks healthier than it is.
What you can do with it
Switch between Revenue, Requested payouts, Paid payouts, and Revenue after payouts tiles to trend each measure on its own chart
Compare any period against the prior period of equal length, with the payout rate change shown in percentage points
Check the Health Score for average order value and payout rate signals, scored against a reference benchmark, with a notice on how many signals could be scored
Sort the Product contribution table by revenue after payouts, revenue, or paid payouts to see which products carry the business
Customize the page to show or hide the Health Score and Product contribution sections
How it fits with the rest of QuantSentry
Business performance reads from the same revenue and payout figures as Overview, so the numbers reconcile wherever you look.
From here you can jump into Orders to see the settled orders behind the revenue figure, into Payouts to see the requests and payments behind each payout measure, or into Products to compare product-level economics in more depth.